Greater Brisbane Fish Barrier Prioritisation
The objective of the Greater Brisbane Fish Barrier Prioritisation (GBFBP) was to identify and assess the large number of man-made barriers that prevent, delay, or obstruct fish migration in the Greater Brisbane (GB) region.
, South Pine River")
Fish barriers identified and ranked
Download the Greater Brisbane Fish Barrier Prioritisation Report
Fish barriers identified through this process were ranked in order of priority, accounting for the cumulative impacts barriers have on the environment, fisheries resources, economy, and the local community.
Fish migration is an essential life history adaptation utilised by many freshwater fish species in the GB region.
Migration strategies between key habitats have evolved for a variety of reasons, including feeding and reproduction purposes, predator avoidance, nursery habitat utilisation, and maintaining genetic diversity.
Barriers preventing connectivity in the GB region impact fisheries’ productivity and create environmental conditions favourable for invasive pest fish species. Significantly, almost half of the GB freshwater fish species undertake life-cycle dependant movements between estuarine and freshwater environments.
Remediating barriers and maintaining connectivity between saltwater and freshwater is therefore critical to ensure freshwater fish community condition and to improve overall aquatic ecosystem health. This project aimed to address such issues through identifying, ranking, and remediating fish passage barriers throughout the GB region.
Fish Barriers - Showing the location of 13,629 potential barriers identified in the Greater Brisbane Fish Barrier Prioritisation project undertaken by Catchment Solutions
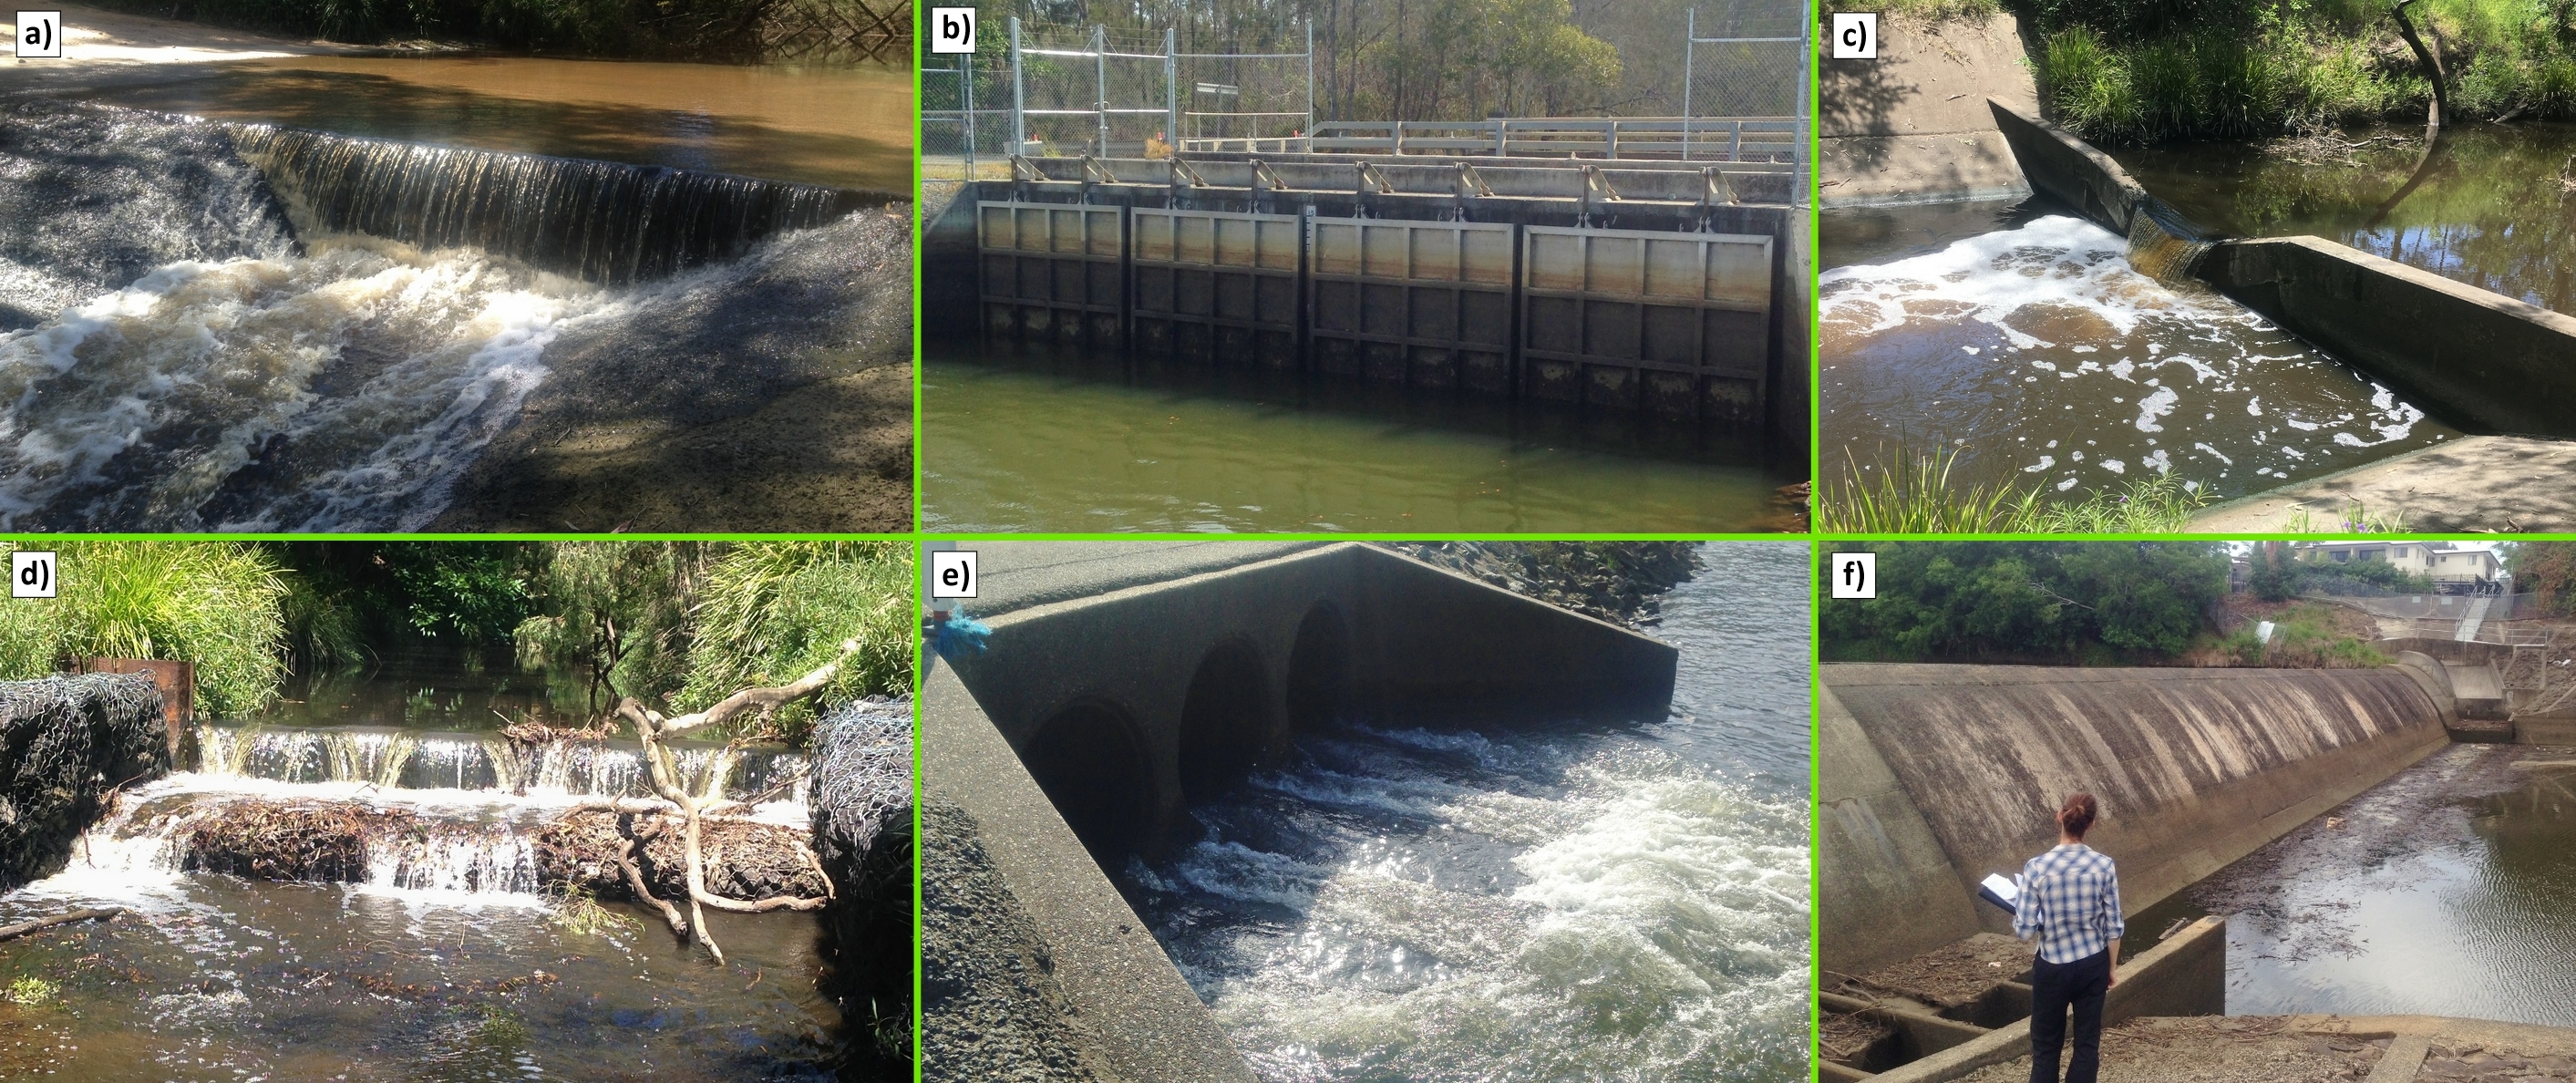
The fish barrier prioritisation process involved identifying potential barriers using high resolution aerial imagery across the GB region. In total, 13,629 potential barriers were identified in the project area (3,582 km2) at a rate of 3.8 potential barriers per km2. Geographic Information System (GIS) software was then applied to rapidly assess and prioritise the high number of potential barriers using a collective optimisation rank-and-score approach. Importantly, key socio-economic flow-on benefits of improving aquatic ecosystem connectivity were considered i.e. the degree to which barrier remediation may increase fisheries productivity and/or conserve vulnerable fish species, e.g. jungle perch.
In many parts of the world, remediation of man-made barriers with appropriately designed fishways (fish ladders) is one of the most successful management tools utilised by government agencies and natural resource management groups to help restore populations of fish impacted by barriers. Objectively choosing the ‘right’ barriers to remediate in order to obtain the greatest benefits requires a holistic prioritisation process. In this prioritisation assessment, the process guided the authors to groundtruthing the top priority potential barriers in order of importance. The resultant GBFBP report and associated priority ranked fish barrier list will assist natural resource managers and decision makers in determining where best to allocate funding opportunities to ensure the greatest environmental and socio-economic outcomes for the GB region.
Results – Top ranking fish barriers in the Greater Brisbane region
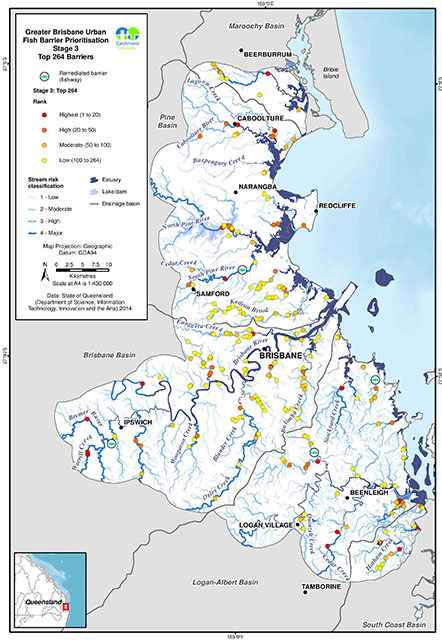
13,629 potential barriers within the GB region were identified and refined to a list of the highest priority sites within the region (top 55 ranked fish barriers). The priority ranked sites represent the greatest return in terms of ecological restoration with the least financial expenditure. By remediating fish passage at these sites, extensive areas of fish habitat will become accessible to many socio-economically important migratory fish species. This will ensure the sustainability of fish populations and improve aquatic ecosystem health in many of the region’s waterways, while investing rehabilitation funds in the most efficient manner.
Results – Top ranking fish barriers in the Greater Brisbane region
The links below will enable you to access the Google Earth or GIS shape files to view mapped areas of priority ranked barriers for this project.
Please note you will need to have Google Earth or GIS software installed (instructions provided below).
Greater Brisbane Urban Fish Barrier Prioritisation List (actual and potential barriers)
Download Google Earth Files Download GIS Shape Files
Top 173 Priority Ranked Brisbane Urban Fish Barriers
Download Google Earth Files Download GIS Shape Files
Instructions for installing Google Earth and Queensland Globe on Mac or PC are available at: https://www.business.qld.gov.au/business/support-tools-grants/services/mapping-data-imagery/queensland-globe/install-mac-pc
Fish Barrier Map Information Fields
Information on what the attribution fields refer to. Once in the map, click on barrier waypoint (small circle) to access this information and details for each barrier.
| GIS Alias | Full Text and Meaning |
|---|---|
| BarrierID: | Unique geo-referenced identification number for each potential or actual barrier |
| Q1_StmOrdr: | Question 1: Stream order the potential barrier is located on. |
| Q2LandUse: | Question 2: Landuse. The proportion of intensive land use within the sub-catchment the potential barrier is located in. |
| Q3Bar_DStr: | Question 3: Number of potential barriers located downstream of the potential barrier in question |
| Q5_DisNxtB: | Question 5: Distance to the next potential barrier upstream |
| Q4_Score: | Question 4: Barriers geographic location within the sub-catchment, i.e. Distance (km) of sub-catchment upstream of the barrier as a proportion (%) of the total sub-catchment stream network (km). |
| Stg1_Scr: | Stage 1 Score: The sum of all five questions after stage 1 of the barrier prioritisation. |
| Stg1_Rnk: | Stage 1 Rank: Potential barriers rank after stage 1 of the prioritisation process. |
| Waterway: | Waterway Name. |
| Barr_Name: | Potential Barrier Name and/or Brief Barrier Description |
| Q6BarType: | Question 6: Barrier Type (Barrier headloss). |
| Q7StrmCond: | Question 7: Stream Condition. Riparian, bed and bank condition. |
| Q8FlowCond: | Question 8: Stream Flow Classification. Perennial, seasonal or supplemented? |
| Q9HabCond: | Question 9: Instream Fish Habitat Condition. Snags, pool, run, riffle, macrophytes, undercut banks? |
| Q10ProxEst: | Question 10: Barriers proximity to estuarine habitats |
| Stge2_Scr: | Stage 2 Score |
| Stge1_2_Sc: | The sum of Stage 1 and Stage 2 scores |
| Q11_Cost: | Question 11: Estimated cost of barrier remediation i.e. cost to construct fishway |
| Q12_ComSup: | Question 12: Community & in-kind Support within the sub-catchment the barrier is located in, i.e. NRM Creek rehabilitation project or Council provide in-kind excavator |
| Q13Tech_V: | Question 13: Technical viability. How difficult is the fishway to design, construct and maintain? |
| Q14_Produc: | Question 14: Fisheries Productivity & Economic Benefits of providing unimpeded connectivity past the barrier |
| Q15Conserv: | Question 15: Conservation Significance. Will improved connectivity benefit listed fish species? |
| Q16Transpa: | Question 16:Barrier Transparency. How often are fish able to ascend past the barrier? |
| Stge3_Scr: | Sum of all questions in stage 3. |
| Tot_3_Stge: | Sum of all 3 stages (total score) |
| Final_Rnk: | Barriers Priority Rank after 3 stages of the barrier prioritisation. Rank 1 = most important fish barrier in the targeted area. |
| Visit: | Was the barrier visited (ground-truthed) in the field, Y = Yes, N= No. |
This report forms part of the overarching project Re-Connecting Aquatic Habitats Across the Greater Brisbane Urban Area, which was commissioned by the Federal Government under the Targeted Area Grants program via Reef Catchments Limited (RCL) Natural Resource Management (NRM) group.


